

_edited.jpg)

About Demand Curves: Types, Examples, and Their Role in Microeconomics
- Sep 20, 2025
- 9 min read
Demand Curves in Microeconomics
Demand Curves: What They Are, Types, and Examples
A demand curve is one of the most essential tools in microeconomics. It visually represents the relationship between the price of a good or service and the quantity that consumers are willing and able to purchase within a given period. Typically, the price is plotted on the vertical (y) axis, while the quantity demanded is shown on the horizontal (x) axis. By studying the demand curve, economists, businesses, and policymakers can better understand consumer preferences, predict market trends, and design pricing strategies.
What Is the Demand Curve?
The demand curve illustrates the price points at which consumers are prepared to purchase different amounts of a product. For most goods and services, the relationship is inverse—as the price increases, the quantity demanded decreases, and as the price decreases, the quantity demanded increases. This phenomenon is known as the Law of Demand.
For example:
If the price of coffee rises significantly, consumers may buy fewer cups or switch to alternatives like tea.
On the other hand, if coffee prices drop, more people may increase their consumption or upgrade to premium versions.
The curve itself is not always identical across markets. Its slope, steepness, and shape depend on the type of good, consumer preferences, and overall market conditions. While many demand curves slope downward, there are exceptions—such as Giffen goods or Veblen goods—where demand behaves differently.
Why Demand Curves Matter
Understanding consumer behavior: The curve provides insight into how sensitive consumers are to price changes (elasticity of demand).
Business decisions: Firms use demand curves to set prices, estimate revenue, and plan production levels.
Public policy: Governments rely on demand analysis to predict the effects of taxes, subsidies, or regulations on markets.
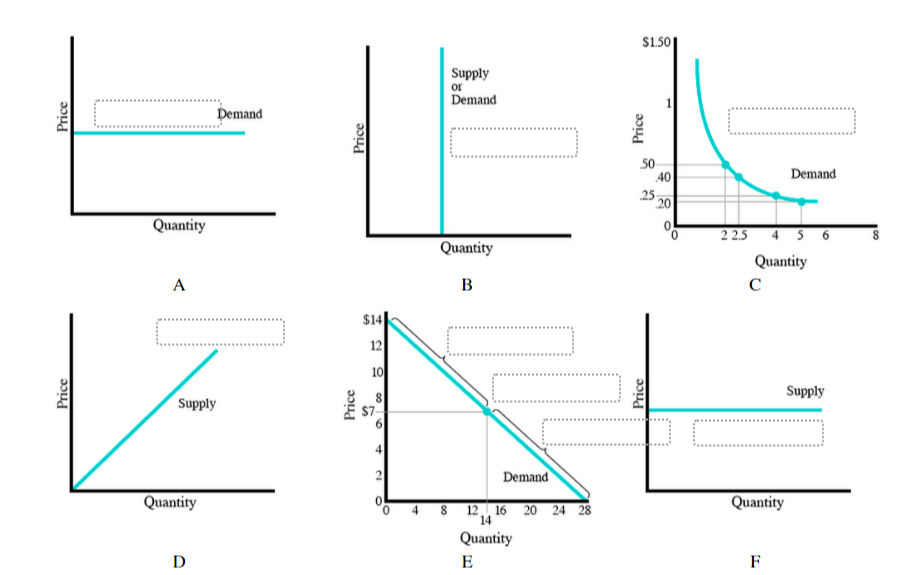
By analyzing demand curves, decision-makers can determine not just how much consumers are willing to buy, but also why their choices change with price. Graph A: Perfectly Elastic Demand
Description: The horizontal line shows that the price remains constant regardless of the quantity demanded.
Elasticity Type: Perfectly elastic demand.
Interpretation: Consumers will buy any quantity at a given price, but if the price rises even slightly, demand drops to zero. Common for commodities in highly competitive markets.
Graph B: Perfectly Inelastic Supply or Demand
Description: The vertical line shows that the quantity demanded (or supplied) stays the same regardless of price changes.
Elasticity Type: Perfectly inelastic (could be demand or supply).
Interpretation: For example, life-saving medicines or classic artworks—no matter the price, quantity remains fixed.
Graph C: Generally Elastic Demand
Description: The curve slopes steeply downward, indicating price changes lead to significant shifts in quantity demanded.
Elasticity Type: Elastic demand curve.
Interpretation: Luxury goods, many substitutes—consumers are highly responsive to price; if price falls, quantity demanded rises sharply.
Graph D: Perfectly Elastic Supply
Description: The upward-sloping straight line demonstrates that as price increases, so does the quantity supplied.
Elasticity Type: Perfectly elastic supply.
Interpretation: This is typical in businesses where suppliers can produce any amount at a set price, perhaps due to unlimited resources.
Graph E: Standard Market Demand & Supply Curves
Description: A downward-sloping demand curve and upward-sloping supply curve intersect to show equilibrium price and quantity.
Elasticity Types:
Demand curve: Standard/Unit elastic (varies by steepness).
Supply curve: Standard/Unit elastic (varies by steepness).
Intersection: Market equilibrium.
Interpretation: This is the classic depiction showing how market prices and quantities are set by the interaction of supply and demand, with varying elasticities depending on their steepness.
Graph F: Perfectly Elastic Supply
Description: The horizontal line is a supply curve showing that any quantity can be supplied at a given price.
Elasticity Type: Perfectly elastic supply.
Interpretation: Suppliers will provide whatever quantity is demanded at a fixed price, often seen in standardized products.
Image Explanation
This diagram visually categorizes supply and demand curves based on their elasticity. These shapes help economists and businesses understand how price changes will impact overall market quantity. For instance, perfectly elastic demand curves mean extreme price sensitivity, while perfectly inelastic curves represent necessities or unique goods where consumer or supplier response to price is nonexistent.
Overall Summary:Demand and supply curves indicate how prices and quantities interact in real markets. Their elasticity (how flat or steep they are) determines market reactions to price changes—crucial for understanding consumer choices, setting prices, and predicting market outcomes in microeconomics. Types of Demand Curves in Microeconomics:
Understanding demand curves is crucial for interpreting consumer behavior and market dynamics. They not only show how quantity demanded changes with price but also reveal patterns, trends, and exceptions in real-world markets.
1. Individual Demand Curve
An individual demand curve illustrates the quantity of a product that a single consumer is willing to buy at different price points. It reflects personal preferences, budget constraints, and willingness to pay.
Example:Suppose Joel buys four slices of pizza when each costs $1.50. If the price drops to $1, he might increase his purchase to six slices. By plotting these price-quantity combinations on a graph, we create Joel’s individual demand curve.
This curve is downward-sloping, showing the inverse relationship between price and quantity demanded—as the price decreases, the quantity demanded increases.
2. Market Demand Curve
A market demand curve is derived by summing all individual demand curves in a market. It shows the total quantity demanded by all consumers at each price level.
Market demand curves are generally flatter than individual demand curves because aggregation smooths out individual variations in responsiveness to price changes.
This curve helps businesses and policymakers predict overall market demand and make pricing, production, or regulatory decisions.
Demand Elasticity
Not all demand curves are the same. One major factor is price elasticity of demand—how sensitive the quantity demanded is to changes in price.
Elastic goods: Small changes in price lead to large changes in quantity demanded. Examples include luxury items like designer clothes or chocolate bars.
Inelastic goods: Quantity demanded is relatively unaffected by price changes. Examples include necessities like salt or insulin.
Understanding elasticity helps firms and governments make informed pricing, taxation, and subsidy decisions.
Shifts in Demand Curves
Demand curves don’t shift due to price changes alone. Various non-price factors can cause the curve to move either right (increase in demand) or left (decrease in demand):
Changes in population: More people usually increase total demand.
Income levels: Higher incomes can boost demand for normal goods, shifting the curve right.
Consumer preferences: Trends and tastes affect what people buy.
Prices of substitutes or complements: The cost of alternatives or complementary goods can shift demand.
Expectations of future prices: Anticipated price changes can lead consumers to buy more or less now.
Example: Rising incomes or a population boom typically shift the demand curve to the right, meaning a higher quantity is demanded at every price level.
Exceptions: Giffen and Veblen Goods
While most goods follow the law of demand (higher price → lower demand), some exceptions exist:
Giffen goods: Basic staples with no close substitutes may see increased demand as price rises, because consumers can’t easily switch and must allocate more of their budget to the good.
Veblen goods: Luxury items whose prestige value increases with price. Higher prices can make the goods more desirable, leading to higher demand.
Image Description and Explanation
Visualizing demand and supply through graphs strengthens understanding:
A: Perfectly elastic demand—quantity demanded changes infinitely with any price change.
B: Perfectly inelastic supply or demand—quantity does not change regardless of price.
C: Typical downward-sloping demand curve—shows inverse relation between price and quantity.
D: Upward-sloping supply curve—suppliers offer more as price rises.
E: Market equilibrium—where demand and supply intersect.
F: Perfectly elastic supply—suppliers can provide any quantity at a fixed price.
These diagrams provide a clear, visual explanation of how prices, quantity, and market forces interact.
Conclusion
Demand curves are fundamental tools in microeconomics, enabling us to interpret and predict how markets respond to price changes. By understanding individual and market demand, elasticity, curve shifts, and exceptions, businesses, policymakers, and consumers gain insight into market behavior. Whether for setting prices, planning production, or designing policies, demand curves provide a powerful framework for analyzing economic decisions. 20 MCQs based on the topic of demand and supply curves, elasticity types, and related concepts, with answers and explanations:
What does a perfectly elastic demand curve look like?
A) Vertical line
B) Horizontal line
C) Downward sloping curve
D) Upward sloping curve
Answer: B
Explanation: A perfectly elastic demand curve is horizontal, meaning quantity demanded is infinite at a specific price.
Which elasticity type does a vertical supply curve represent?
A) Perfectly elastic supply
B) Unit elastic supply
C) Perfectly inelastic supply
D) Elastic supply
Answer: C
Explanation: A vertical supply curve indicates perfectly inelastic supply; quantity supplied does not change with price.
What does a steep downward sloping demand curve indicate?
A) Perfectly inelastic demand
B) Elastic demand
C) Inelastic demand
D) Perfectly elastic demand
Answer: C
Explanation: A steep demand curve means quantity demanded responds little to price changes, indicating inelastic demand.
Upward sloping straight supply curves usually represent:
A) Perfectly inelastic supply
B) Unit elastic supply
C) Perfectly elastic supply
D) Elastic supply
Answer: D
Explanation: Supply increases as price increases, typical of elastic supply.
In Graph E, the intersection of demand and supply curves is called:
A) Price floor
B) Market equilibrium
C) Surplus point
D) Shortage point
Answer: B
Explanation: The price and quantity at which supply equals demand is market equilibrium.
What does a perfectly elastic supply curve look like?
A) Downward sloping
B) Upward sloping
C) Vertical line
D) Horizontal line
Answer: D
Explanation: A horizontal supply curve means suppliers provide any quantity at a fixed price, i.e., perfectly elastic supply.
Elasticity measures:
A) How demand or supply changes with income
B) The responsiveness of quantity demanded or supplied to price changes
C) The overall demand in a market
D) The total revenue of suppliers
Answer: B
Explanation: Elasticity gauges how quantity demanded or supplied changes in response to price changes.
If a small price decrease leads to a large increase in quantity demanded, demand is:
A) Inelastic
B) Elastic
C) Unitary elastic
D) Perfectly inelastic
Answer: B
Explanation: Demand that is highly responsive to price changes is elastic.
Which goods typically have inelastic demand?
A) Luxury cars
B) Basic necessities
C) Designer clothes
D) Substitute products
Answer: B
Explanation: Necessities tend to have inelastic demand because consumers need them regardless of price.
If supply curve shifts rightward, what happens to quantity and price (assuming demand constant)?
A) Price increases, quantity decreases
B) Price decreases, quantity increases
C) Both increase
D) Both decrease
Answer: B
Explanation: Increased supply reduces price and increases quantity supplied.
What is unitary elasticity?
A) Quantity changes proportionally with price
B) Quantity doesn’t change with price
C) Quantity changes more than price
D) Quantity changes less than price
Answer: A
Explanation: When percentage change in quantity equals percentage change in price, elasticity is unitary.
Which of these shifts the demand curve to the right?
A) Income decrease
B) Price rise of substitute
C) Population growth
D) Price increase of compliments
Answer: C
Explanation: More consumers increase demand at any given price, shifting the curve right.
What type of goods defy the law of demand and have upward sloping demand curves?
A) Giffen and Veblen goods
B) Normal goods
C) Inferior goods
D) Substitute goods
Answer: A
Explanation: Giffen and Veblen goods see demand rise as price rises due to unique consumer behavior.
If demand is perfectly inelastic, elasticity value is:
A) 0
B) 1
C) Greater than 1
D) Infinite
Answer: A
Explanation: Perfectly inelastic demand means quantity demanded doesn’t change with price.
Which curve represents a perfectly elastic supply?
A) Vertical supply curve
B) Horizontal supply curve
C) Upward sloping supply curve
D) Downward sloping supply curve
Answer: B
Explanation: Horizontal supply curve shows suppliers willing to supply unlimited quantity at fixed price.
An increase in consumer preferences for a product causes:
A) Movement along demand curve
B) Shift right of demand curve
C) Shift left of demand curve
D) No change in demand
Answer: B
Explanation: Higher preference increases demand at all price levels.
Which factor does NOT cause a shift in supply?
A) Change in technology
B) Change in input prices
C) Change in product price
D) Change in number of suppliers
Answer: C
Explanation: Price changes cause movement along supply curve, not shift.
The downward sloping demand curve reflects:
A) Increasing quantity demanded as price increases
B) Law of supply
C) Law of demand
D) Elasticity
Answer: C
Explanation: Price and quantity demanded inversely related per law of demand.
What happens to demand if the price of a complement rises?
A) Increases
B) Decreases
C) No change
D) Becomes elastic
Answer: B
Explanation: Higher price of complement lowers demand for related goods.
At equilibrium price,
A) Quantity demanded is greater than quantity supplied
B) Quantity supplied is greater than quantity demanded
C) Quantity demanded equals quantity supplied
D) Price is fixed regardless of supply and demand
Answer: C
Explanation: Equilibrium is point of balance between demand and supply.
#DemandCurve #SupplyCurve #Elasticity #Microeconomics #LawOfDemand #MarketEquilibrium #EconomicsEducation #EconGraphs


Ở góc độ quan sát, GGwin Đăng Nhập cho mình cảm giác hệ thống chú trọng khá nhiều đến việc tối ưu trải nghiệm tổng thể. Mình để ý các khu vực như tài khoản, giao dịch và hỗ trợ đều được sắp xếp ở vị trí khá dễ tiếp cận, còn những nội dung giải trí cũng được tổ chức thành từng nhóm riêng. Bên cạnh đó, việc hỗ trợ trên nhiều thiết bị giúp quá trình sử dụng trở nên linh hoạt hơn.