

_edited.jpg)

The Hicks Substitution Effect Explained: Theory, Detailed Graphs, and Real Applications (2025 Guide)
- Sep 24, 2025
- 7 min read
The Hicks Substitution Effect: Theory, Application, and Graphical Explanation
Introduction
The Hicks substitution effect represents a vital concept in microeconomic theory, demonstrating how consumers reallocate their purchasing decisions when the relative prices of goods shift, provided that their utility remains constant. Understanding the Hicksian approach is essential both for theoretical clarity and practical exam performance, as it explains how demand responds exclusively due to price changes—independent of changes in real income.
Concept and Definition
The Hicks substitution effect isolates the effect of changing relative prices by compensating a consumer’s income so that their level of satisfaction (utility) does not change. When one good’s price falls, the consumer substitutes it for others, increasing the consumption of the cheaper good, but stays on the same indifference curve—ensuring no rise in actual utility.
Price Effect=Substitution Effect+Income EffectPrice Effect=Substitution Effect+Income Effect
Substitution effect: Change in consumption along the initial indifference curve due solely to the change in relative prices.
Income effect: Shift to a higher or lower indifference curve as the consumer’s effective purchasing power changes after a price shift.
In-Depth Graph Explanation
How to Read the Hicksian Substitution Graph
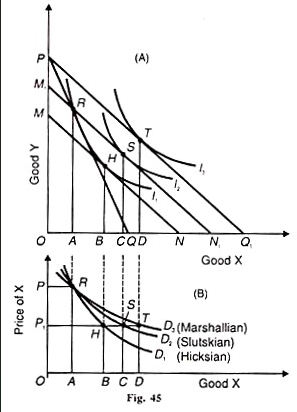
The graph attached—a stylized indifference curve map—serves as a practical illustration for the Hicks method:
Initial Equilibrium (Point X):
The consumer’s initial budget line is tangent to their highest attainable indifference curve at point X.
Here, the consumer balances goods A and B given original prices and income, maximizing their satisfaction.
Price Change and New Budget Line:
Suppose the price of good A falls. The budget line pivots outwards from its original position, reflecting increased purchasing capacity for A while B’s price is unchanged.
The new budget line (P1) makes more bundles affordable.
Compensating Income Variation:
To isolate the pure effect of price change (substitution effect), the consumer’s income is reduced just enough to return them to their original utility (same indifference curve).
This adjustment creates a new, parallel budget line tangent to the original indifference curve.
Movement Along the Indifference Curve (Substitution Effect):
The consumer moves from X to Y along the same curve. This new bundle represents the Hicks substitution effect—consumers buy more of A (now cheaper) and less of B, but without improving their overall utility.
Income Effect:
After accounting for the substitution effect, if the consumer resumes their actual (unreduced) income, they move to point Z on a higher indifference curve—this is the income effect, representing greater overall satisfaction due to increased effective income.

Visualization Tip:
Arrow directions should be labeled: X → Y (substitution effect) and Y → Z (income effect).
The key distinction is that the substitution effect is always along the same indifference curve.
Hicks vs. Slutsky: Graphical and Conceptual Differences
Method | What’s Held Constant | How Income Is Adjusted | Graphical Path | Best For |
Hicksian | Utility (same indifference curve) | Compensating variation | Along original indifference curve | Theoretical clarity, exams |
Slutsky | Purchasing power (original bundle affordable) | Difference in cost | To a parallel (shifted) budget line | Empirical data, cost analysis |
Practical Example
Suppose a staple food like rice drops in price. Using the Hicks method:
The substitution effect is the consumer buying more rice instead of bread, simply because rice is now cheaper.
By “compensating” income down, we see only the impact due to the price change (not the resulting extra satisfaction or utility that’s possible from those savings).
Real-world analysis often uses this decomposition to design policy interventions, like food subsidies, that optimize welfare without unintended market distortions.
Importance and Applications
Consumer Theory: Clarifies movements along indifference curves and distinguishes how choices change with price versus true changes in wealth.
Policy Analysis: Allows economists and policy-makers to predict consumer responses to taxation and subsidies—especially for essential goods.
Exam Strategy: Diagrams should illustrate the separation of substitution and income effects clearly—use distinct colors for each shift and always explain the logic behind each step.
Common Exam Questions on Hicks Substitution Effect
Draw and explain the Hicks substitution effect using indifference curves and budget lines for normal, inferior, and Giffen goods.
Compare and contrast the Hicks and Slutsky substitution effects, both diagrammatically and conceptually.
Explain why the Hicks substitution effect is always positive (leads to increased demand for a good when its price falls).
Summary
The Hicks substitution effect, with its focus on constant utility and compensating income adjustments, is central to advanced microeconomics. It provides the foundation for analyzing market changes, preparing robust answers in exams, and informing real-world policy. Accurate diagramming and clear explanations are the hallmarks of mastery in this area. Hicks Substitution Effect – 20 Theory MCQs
1.
The Hicks substitution effect is concerned with:
A) Changes in prices and income simultaneously
B) Change in consumption caused by relative price change at constant utility
C) Measuring demand elasticity empirically
D) Shifts in market supply
Answer: B
Explanation: Hicks substitution effect isolates the change in demand due to a relative price change, keeping utility constant.
2.
The main feature of the Hicks approach is that:
A) Real income remains unchanged
B) Utility remains constant
C) Consumption bundle stays the same
D) Both goods remain equally consumed
Answer: B
Explanation: Hicks compensates income to ensure utility is held constant during analysis.
3.
Which curve is central to illustrating Hicks substitution effect?
A) Demand curve
B) Indifference curve
C) Supply curve
D) Cost curve
Answer: B
Explanation: Indifference curves represent utility levels, crucial for Hicksian analysis.
4.
What happens when the price of one good falls under Hicks’ method?
A) Consumer’s utility rises immediately
B) Consumer substitutes cheaper good for expensive one on the same indifference curve
C) Consumer moves to original budget line
D) Consumer decreases consumption of the cheaper good
Answer: B
Explanation: The cheaper good becomes relatively attractive, so consumption shifts within the same indifference curve.
5.
The price effect can be decomposed into:
A) Price + Quantity Effect
B) Substitution + Income Effect
C) Utility + Cost Effect
D) Budget + Market Effect
Answer: B
Explanation: Total effect of price change is substitution effect plus income effect.
6.
Point X → Y in Hicks diagram shows:
A) Income effect
B) Substitution effect
C) Price effect
D) Giffen paradox
Answer: B
Explanation: Movement from the old bundle to the compensated bundle (same utility) represents substitution effect.
7.
Point Y → Z in Hicks diagram represents:
A) Substitution effect
B) Income effect
C) Price effect
D) Production shift
Answer: B
Explanation: This movement shows changes in consumption as effective purchasing power increases.
8.
Why is substitution effect always positive?
A) Because consumers are irrational
B) Because a fall in relative price always increases demand for the cheaper good
C) Because indifference curves intersect
D) Because income rises in all cases
Answer: B
Explanation: Consumers will always substitute toward the cheaper good if utility is constant.
9.
The income effect’s sign (positive or negative) depends on:
A) Elasticity of demand
B) Normal or inferior nature of the good
C) Shape of budget line
D) Government taxes
Answer: B
Explanation: For normal goods, income effect is positive; for inferior goods, it is negative.
10.
In the Hicks method, compensating variation means:
A) Adding income to match new prices
B) Reducing or adding income to keep utility constant
C) Calculating welfare loss
D) Increasing spending ability
Answer: B
Explanation: Income is adjusted so consumer stays on the same indifference curve.
11.
Which method is more commonly used for theoretical clarity in exams?
A) Slutsky method
B) Hicks method
C) Marshallian demand
D) Revealed preference
Answer: B
Explanation: Hicks is preferred in theory because it keeps utility constant, making substitution clear.
12.
Under Hicks, the new compensated budget line is:
A) Parallel to the new price line and tangent to the original indifference curve
B) Parallel to the old price line and tangent to new curve
C) Intersects demand directly
D) Unchanged after price falls
Answer: A
Explanation: This ensures substitution effect is captured while holding utility constant.
13.
Which step comes immediately after finding substitution effect in Hicks’ method?
A) Final equilibrium including income effect
B) Returning to old prices
C) Moving parallel to Slutsky line
D) Eliminating demand
Answer: A
Explanation: After substitution is captured, income effect is considered to find final bundle.
14.
Graphically, Hicks substitution effect is shown on:
A) Same indifference curve
B) Higher indifference curve
C) Lower indifference curve
D) Isoquant curve
Answer: A
Explanation: The substitution effect is strictly along the same indifference curve, holding utility constant.
15.
For normal goods, both substitution and income effects:
A) Work in the same direction
B) Cancel each other out
C) Always reduce demand
D) Are impossible to separate
Answer: A
Explanation: In normal goods, demand rises due to both substitution and positive income effect.
16.
For inferior goods, income effect is:
A) Always positive
B) Always negative
C) Zero
D) Greater than substitution
Answer: B
Explanation: For inferior goods, higher real income can reduce demand.
17.
A Giffen good arises when:
A) Substitution effect is zero
B) Negative income effect outweighs substitution effect
C) Both effects are positive
D) Price has no effect
Answer: B
Explanation: In Giffen goods, strong negative income effect dominates positive substitution effect.
18.
Why do economists prefer Hicks method for theory and Slutsky for data?
A) Hicks is practical, Slutsky is simple
B) Hicks requires abstract utility, Slutsky uses observable costs
C) Hicks measures expenditure, Slutsky uses utility
D) Both give identical diagrams
Answer: B
Explanation: Hicks is theoretical as utility is abstract; Slutsky is empirical based on real cost adjustments.
19.
Which is the key difference between Hicks and Slutsky substitution effects?
A) One uses utility framework, the other purchasing power
B) One applies to normal goods, the other to inferior goods
C) One is micro, the other macro
D) One uses production curves
Answer: A
Explanation: Hicks holds utility constant, while Slutsky holds original bundle affordability constant.
20.
Why is separating substitution and income effects important?
A) It explains exceptions to law of demand
B) It reduces consumer rationality assumptions
C) It helps predict exact production levels
D) It eliminates price elasticity from theory
Answer: A
Explanation: Distinguishing substitution and income effects clarifies why demand curves slope downward and explains anomalies like Giffen goods.
#HicksSubstitutionEffect #Microeconomics #ConsumerChoice #IndifferenceCurve #SubstitutionEffect #IncomeEffect #SlutskyMethod #BudgetLine #EconomicsGraphs #ExamGuide #UtilityTheory #EconomicsStudy #AdvancedMicroeconomics #Education2025


monero miners monero miners
monero miners monero miners
monero miners monero miners
monero miners monero miners
monero miners monero miners
monero miners monero miners
etc mining etc mining
monero miners monero miners
monero miners monero miners
monero miners monero miners
monero miners monero miners
monero miners monero miners
monero miners monero miners
etc mining etc mining
monero miners monero miners
monero miners monero miners
monero miners monero miners
monero miners monero miners
monero miners monero miners
monero miners monero miners
etc mining etc mining
monero miners monero miners
monero miners monero miners
monero miners monero miners
monero miners monero miners
monero miners monero miners
monero miners monero miners
etc mining etc mining
monero miners monero miners
monero miners monero miners
monero miners monero miners
monero miners monero miners
monero miners monero miners
monero miners monero miners
etc mining etc mining